Webinars, video campaigns, and social media posts are relatively new channels for marketers to reach their customers. But, your contemporary communication methods shouldn’t distract you from one of the oldest, yet most effective, strategies — email marketing. In fact, email ROI is an impressive $36 for every $1 spent.
If you’re still hesitant, keep reading — we’ve cultivated a list of email marketing statistics for HubSpot to demonstrate just how powerful email can be. Here, you’ll find:
- Email Marketing Stat Highlights for 2022
- General Email Marketing Statistics
- B2B Email Marketing Statistics
- Mobile Marketing Statistics
- B2C Email Marketing Statistics
- Email Marketing Demographics for 2022
General Email Marketing Statistics and Best Practices
- Email marketing is used by 1 in 2 media planners. It will continue to grow this year with 22% planning to leverage it for the first time.(HubSpot Blog Research, 2021)
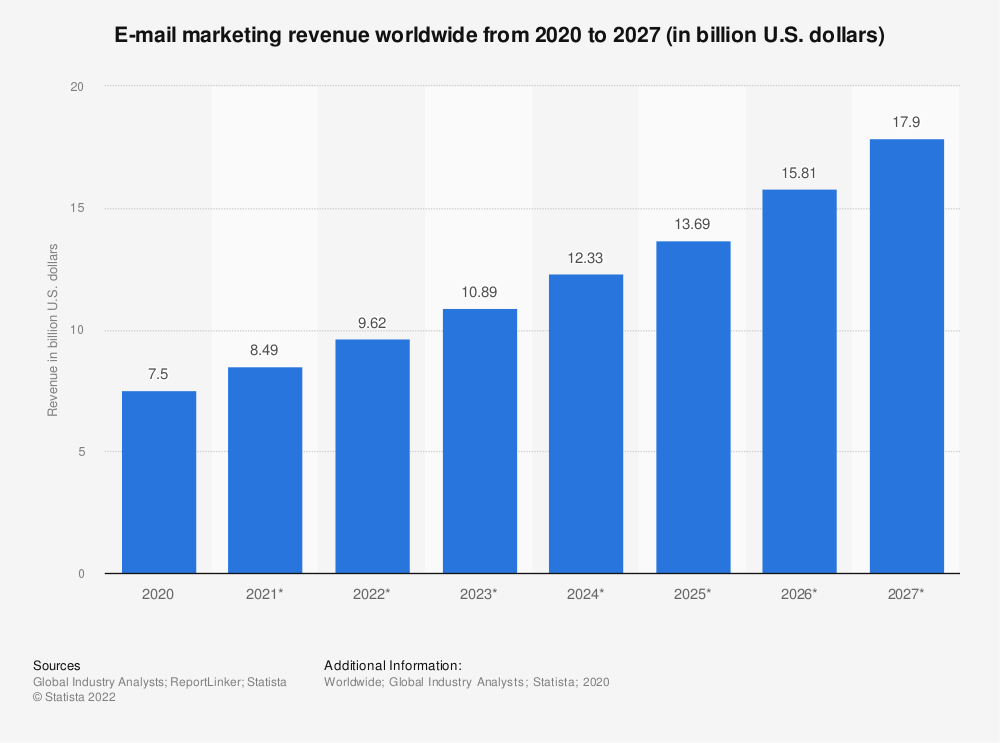
- Email marketing revenue is estimated to reach almost 11 billion by the end of 2023. (Statista, 2021)
- There are 4 billion daily email users. This number is expected to climb to 4.6 billion by 2025. (Statista, 2021)
- More than 306 billion emails are sent and received each day. (Statista, 2021)
- 64% of small businesses use email marketing to reach customers. (Campaign Monitor, 2021)
- 37% of brands are increasing their email budget, and just 1.3% are making cuts. (Litmus, 2021)
- The most effective strategies for email marketing campaigns are subscriber segmentation (78%), message personalization (72%), and email automation campaigns (71%). (HubSpot Blog Research, 2021)
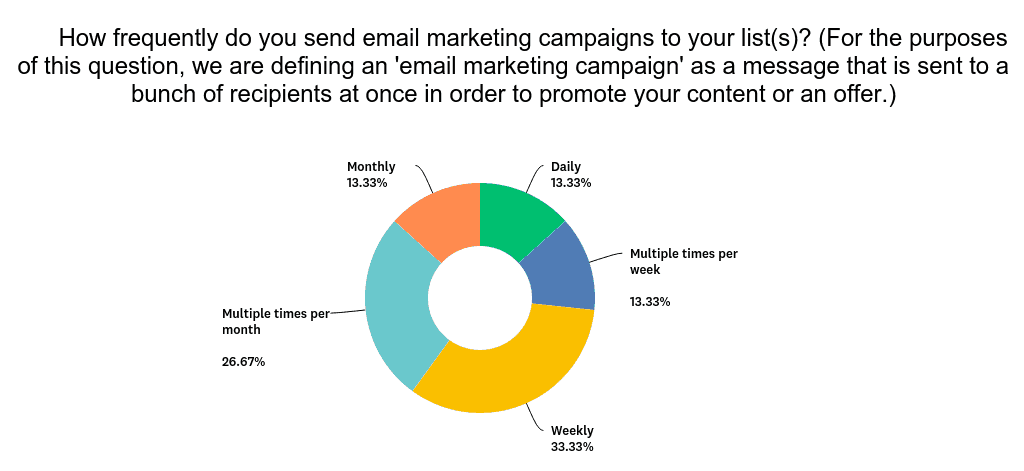
- 33% of marketers send weekly emails and 26% send emails multiple times per month. (Databox, 2022)
- 63% of businesses reduce the frequency of emails send to subscribers based on their levels of engagement. (Databox, 2022)
- 41.5% of brands say that email marketing is very critical to business success, compared to 78% in 2020. (Litmus, 2021)
- 77% of marketers have seen an increase in email engagement over the last 12 months. (Not Another State of Marketing, 2021)
- Globally, Fridays see the highest email open rates (nearly 19%), compared to the lowest open rates (17%) on Saturdays. (Campaign Monitor, 2021)
- 43% of marketers are changing how they measure email performance because of Apple’s Mail Privacy Protection, and 24% aren’t making any changes for now. (Litmus, 2021)
- The most significant way that email marketers adapted to recent data privacy changes was by prioritizing different KPIs. (HubSpot Blog Research, 2021)
- The most effective email subject lines engage curiosity, include promotional offers, and are personalized to each recipient’s interests. (HubSpot Blog Research, 2021)
-
QA, A/B, and spam testing your emails leads to higher ROI. Enjoy up to a 28% higher return when you put testing to work for your email program. (Litmus, 2022)
B2B Email Marketing Statistics
- 81% of B2B marketers say their most used form of content marketing is email newsletters. (Content Marketing Institute, 2020)
-
64% of B2B marketers say their email marketing strategy was effective for meeting business goals in 2021. (HubSpot Blog Research, 2021)
- 15.8% of all emails go missing or have been caught by popular spam filters. (Email Tool Tester, 2022)
- B2B marketers say that new product and feature announcement marketing emails have the highest click-through rate. (HubSpot Blog Research, 2021)
- Automation is primarily used in email marketing to send triggered emails, for drip or nurture campaigns, and segmentation. (Litmus, 2021)
Mobile Marketing Statistics
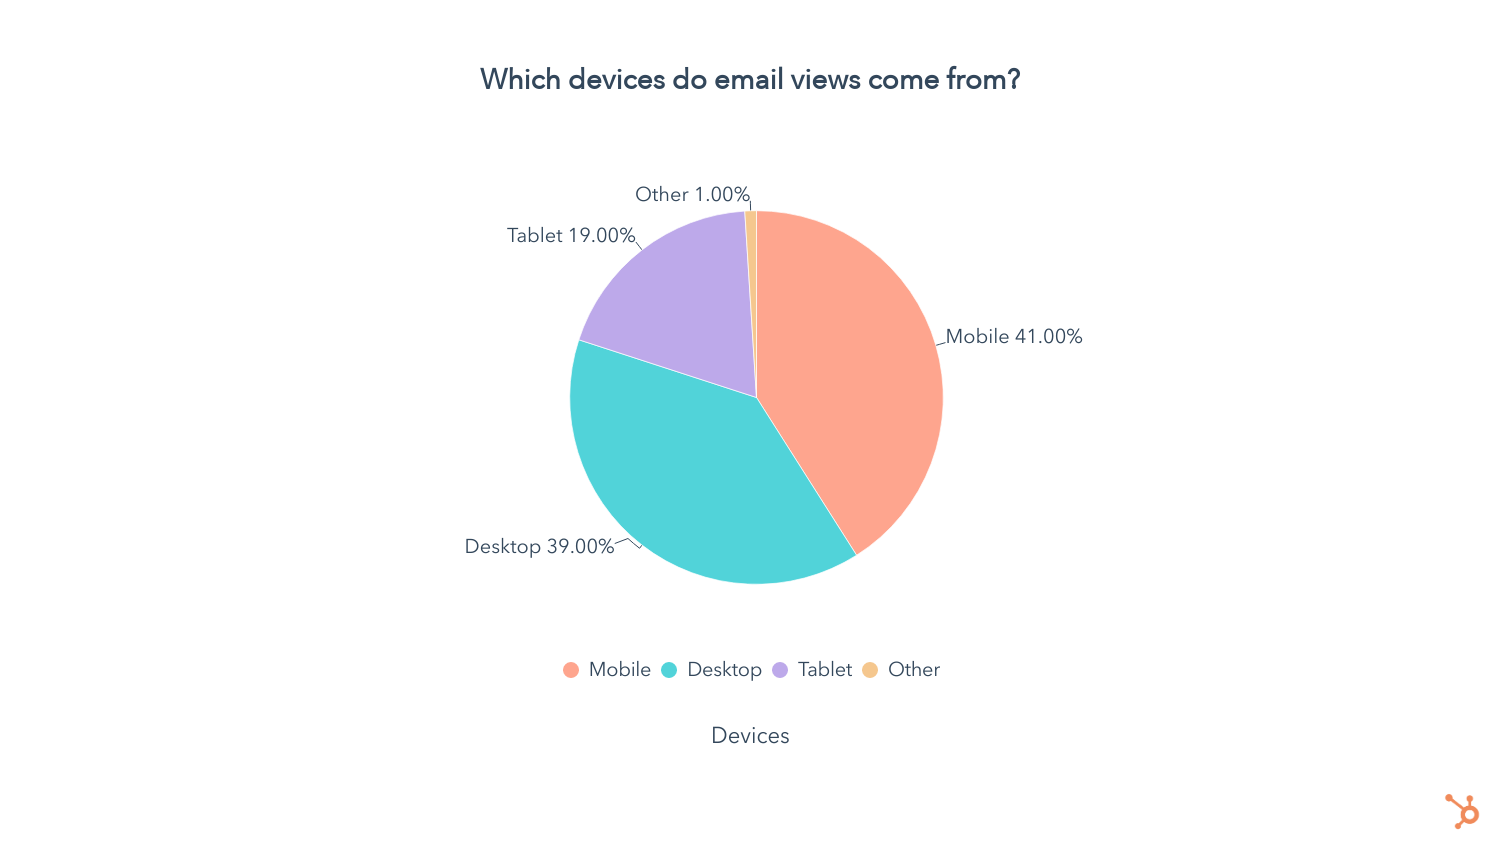
- A majority of email views come from mobile devices (41%), followed by desktop (39%). (HubSpot Blog Research, 2021)
- Nearly 55% of global website traffic is generated from mobile devices, excluding tablets. (Statista, 2022)
- 46% of smartphone users prefer to receive communications from businesses via email. (Statista, 2021)
- Apple iPhone’s native email app has the highest market share, followed by Gmail. (Litmus Labs, 2022)
- Nearly 1 in 5 email campaigns is not optimized for mobile devices. (SuperOffice, 2020)
- Launching a mobile-responsive email design can increase unique mobile clicks by 15%. (MailChimp, 2021)
- 56% of marketers leverage mobile-friendly emails in their email marketing strategy. (HubSpot Blog Research, 2021)
B2C Email Marketing Statistics
- 87% of B2C marketers leverage automation as part of their email marketing strategy. (HubSpot Blog Research, 2021)
-
50% of people buy from marketing emails at least once per month. (Salecycle, 2022)
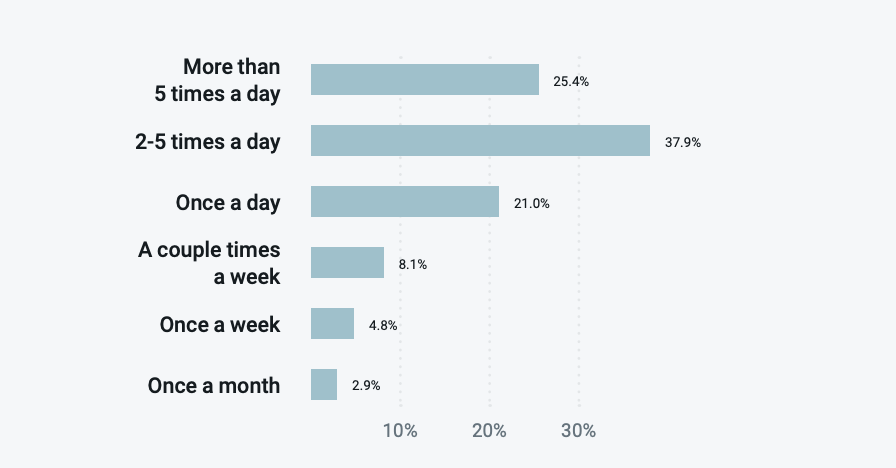
- Your audience will reward you with higher open and click rates if you don’t send more than five newsletters a week. (GetResponse, 2020)
- 60% of retail, e-commerce, and consumer goods and services companies are personalizing emails based on past purchases, versus 38% in 2019. (Litmus, 2020)
- More than 8 out of 10 people will open a welcome email, generating 4x as many opens and 10x as many clicks as other email types. (GetResponse, 2020)
- The single message autoresponder email had an astonishing 98% open rate and a 37% click-through rate. (GetResponse, 2020)
- Nearly 22% of all email campaigns are opened within the first hour of sending. (GetResponse, 2020)
- 15.8% of all emails go missing or have been caught by popular spam filters. (Email Tool Tester, 2022)
- 59% of respondents say that marketing emails have influenced their purchases. (Salecycle, 2022)
- 64% of B2C marketers consider accessibility when creating their emails. (Pathwire, 2021)
Email Marketing Demographics 2021
- 99% of email users check their inbox every day, with some checking 20 times a day. Of those people, 58% of consumers check their email first thing in the morning. (OptinMonster, 2020) 84.3% of consumers say they check their emails at least once a day. (Pathwire, 2021)
- 35% of survey respondents in the U.S. have two email addresses and 28% have over four. (Statista, 2021)
- Consumers spend an average of 10 seconds reading brand emails. (Statista, 2021)
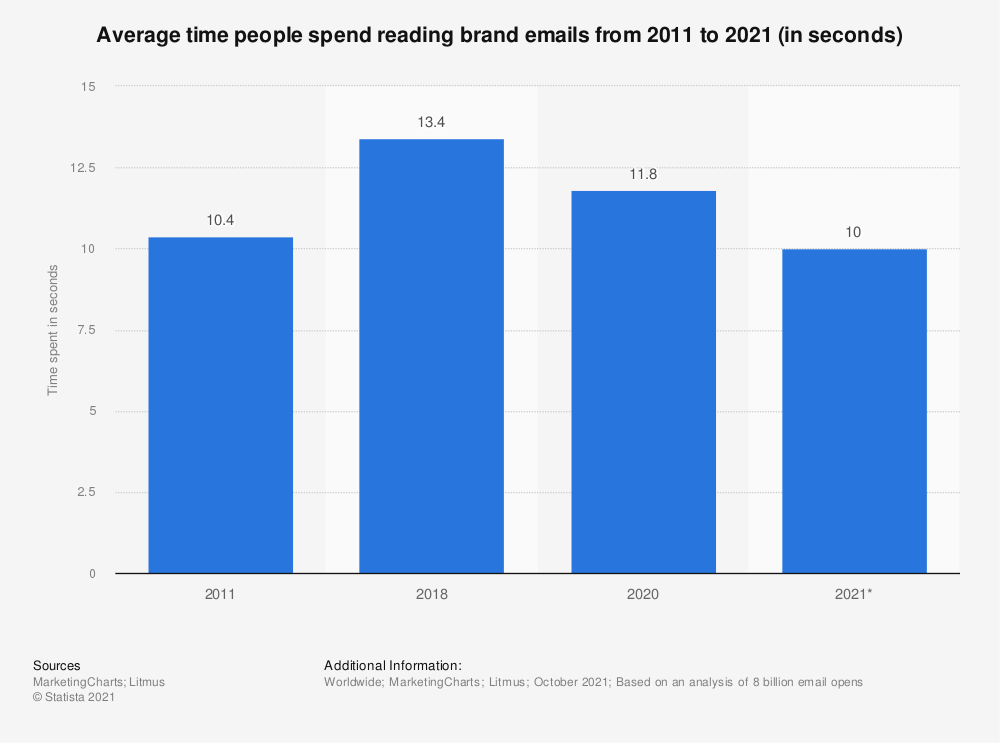
- 40% of consumers say they have at least 50 unread emails in their inbox. (HubSpot, 2020)
- Email is the leading way consumers in the U.S. discover coupons from brands. (Statista, 2021)
- Recognizing a sender is the most important factor in deciding to open an email, followed by actually having the time to read an email. (Pathwire, 2021)
- The average bounce rate across all industries is 9.96%.
(Constant Contact, 2022) - 59% of Millennials primarily use their smartphone to check email, while 67% of Generation Z scans their inbox on mobile. (Bluecore, 2021)
- 74% of Baby Boomers think email is the most personal channel to receive communications from brands, followed by 72% of Gen X, 64% of Millennials, and 60% of Gen Z. (Bluecore, 2021)
- The most significant steps marketers take to champion accessibility when creating their emails is writing short, descriptive subject lines, making links and buttons easy to see, and keeping paragraphs short and simple. (Pathwire, 2021)
Apply Your Email Knowledge
Many of the data points will help you make the case for investing more time and money into your email marketing strategy. While you can refer back to this post at any time, you can also start applying them to your next campaign.
Editor’s Note: This blog post was originally published in March 2019, but was updated for comprehensiveness and freshness.
![]()
Source: Hubspot
Please rate this post

With over 20 years of experience in the car business, I’ve navigated the evolution of the industry from traditional sales to the dynamic digital age. My journey through various roles in both sales and management has endowed me with a unique perspective on the challenges and opportunities in automotive sales today.
As the founder of Shawn Ryder Digital, I combine my extensive background in technology with my deep understanding of the automotive industry. This synergy allows me to craft digital marketing strategies that are not just effective but tailored to the specific needs of each dealership. My commitment is to drive your sales, enhance your brand awareness, and ensure your dealership thrives in the digital landscape.
Here at Shawn Ryder Digital, we’re not just about providing services; we’re about building partnerships. As I often say, “In the fast-paced world of digital marketing, staying ahead isn’t just an option; it’s a necessity.”
Together, let’s embrace the challenges of the digital age and turn them into opportunities for growth and success. Join me in redefining the future of automotive digital marketing. Let’s accelerate your dealership’s journey to the top.


